Do you know how to improve SEO on website?
We want to show you what exactly we are doing to improve SEO for our website. Tools that we are using are completely free, and you can also use them for your web page.
For this study, we are going to use Google Search Console and Google Analytics. Installing these tools won’t improve SEO on website or your organic traffic. You’ll just get a bunch of data. The main question is how you can use all that information? We are here to help you utilize that data and to teach you how to use these tools.
Before we start, we have to familiarize you with the main difference between those two toolsets.
Google Search Console is a tool that counts clicks and visits through Google search, which only counts organic traffic. On the other hand, Google Analytics counts clicks and visits from all sources.
Let’s see how to use these tools to improve SEO on website.
Google Search Console
#1 step
Our first step is to open GSC and click on Search Traffic -> Search Analytics
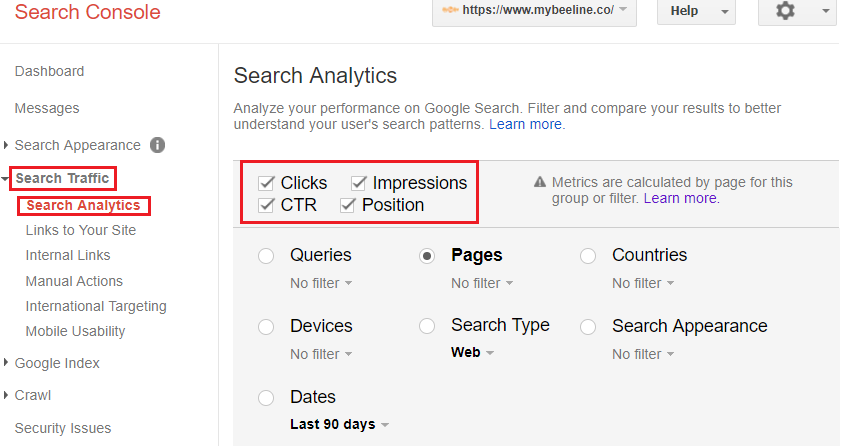
After that, we have to click on the field Clicks -> Impressions -> CTR -> Position and mark them with a tick.
#2 step
The next step is to click on Dates and select analyze Last 90 days. After that, we have to click on Pages and then click on Impressions to filter from highest impressions.
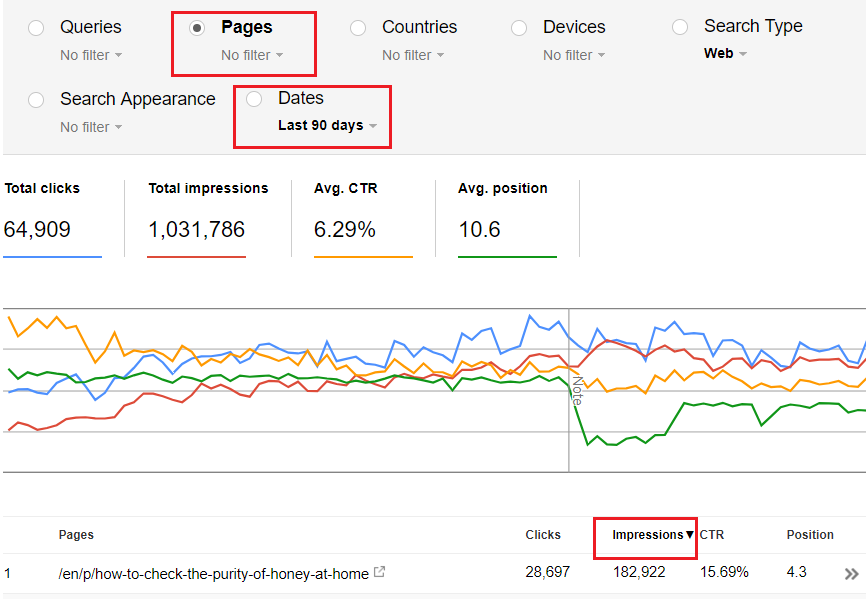
The result will be content that brings the most visitors to our page.
After we have filtered data, we will pick ten articles with the highest number of impressions.
You are probably asking yourself what the meaning of the terms impressions and CTR is?
So, impressions mark the number of links to your site a user saw on Google search results, even if the link was not scrolled into view. However, if the link is not on a page a user viewed, the impression is not counted. For example, if a user views page 1 and the link is on page 3, the impression is not counted.
CTR (Click-Through-Rate) is defined as click count divided by the impression count. If a row of data has no impressions, the CTR will be shown as a dash (-).
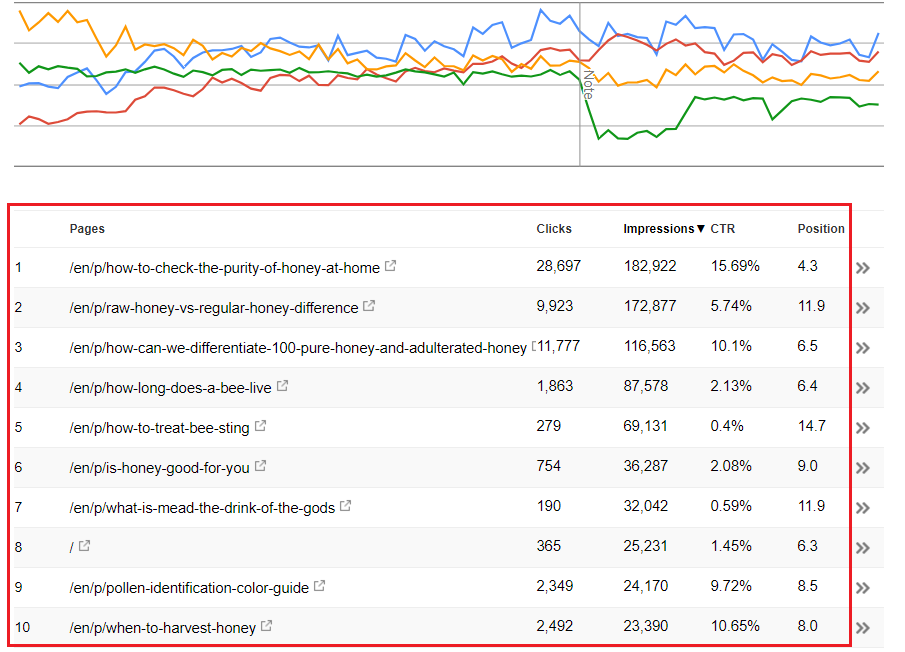
These ten articles we will use for analyzing, so follow these steps because you have to do this for all top 10 articles.
#3 step
In our next step, you need to select an article by clicking on it, then clicking on Queries, and again make a filter from highest impressions. Take a look at the photo below.
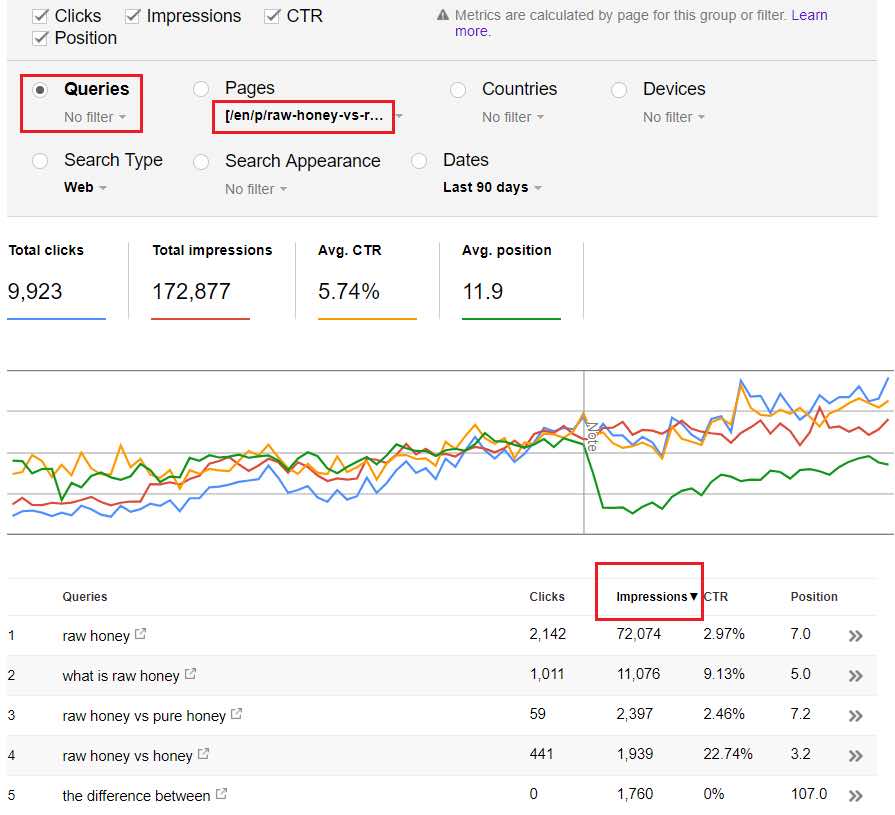
In our example, the keyword “raw honey” has impressions of over 70 thousand, which is pretty high, but CTR is under 3%. The main reason why CTR is not high is our position in Google results (you can see that the average position is 7).
What can we do about that?
Well, to improve CTR, we can change the title of the article (we should do that by analyzing the titles of articles which are in Google result positioned higher than we are). We can try to change a description of the article and make it more attractive in 2-3 sentences.
You have to work on improving your position in Google results for keywords with the highest impressions. To improve the number of impressions, you need to share your article through different channels to be available to more people.
#4 step
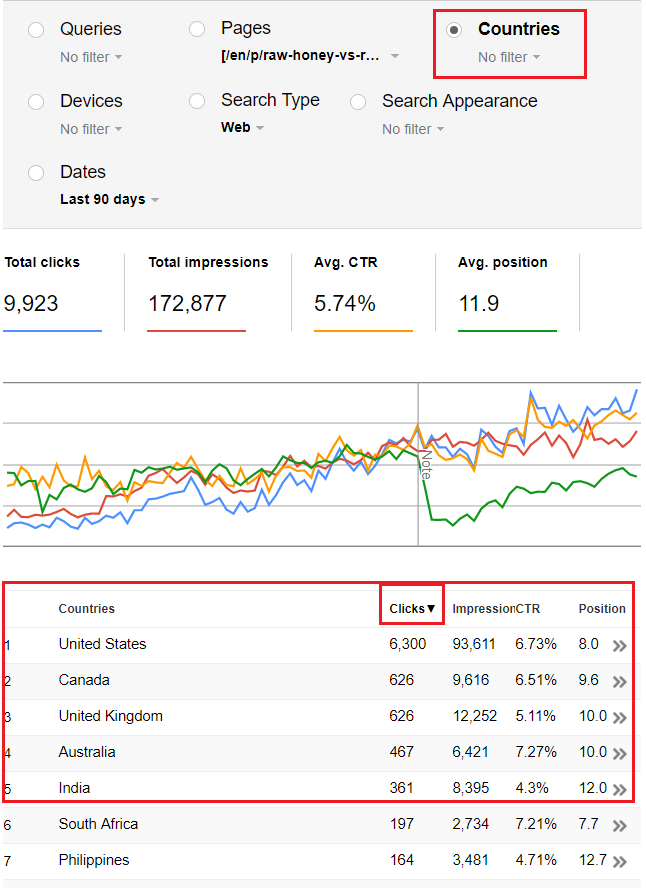
Next step, click on Countries and then analyze the top 5 countries which are giving you the most visitors. For those countries, your page must be in a high position in Google results. Also, now we have to mention “time“, you need to check how long is required to load your page in these countries (check step Step 5 in GA).
#5 step
The next thing we need to check in GSC are links to our article. So, click on Internal Links-> Chose to show 500 rows and find your article. To find your article, press CTRl+F and type a keyword from the caption of your article (we have typed “raw”).
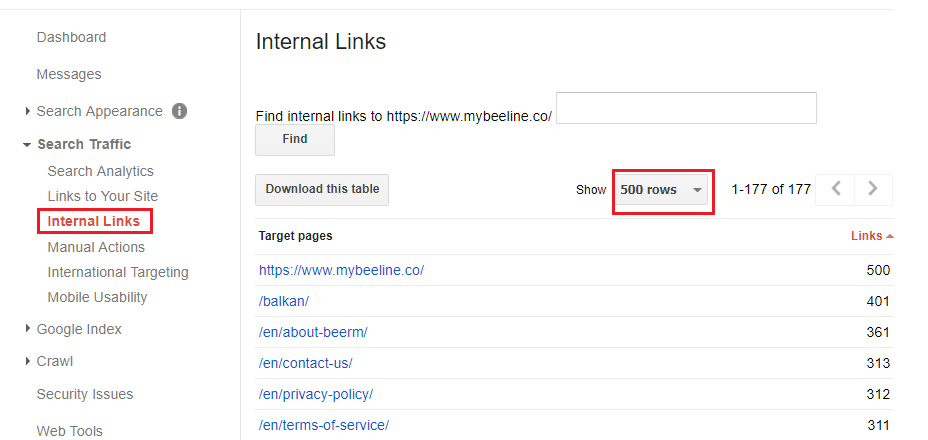
After you have found your article, click on it, and you will see the number of links to your content.

You have to gravitate to having as many links as possible because the higher the number of the links, the higher will Google rank your content, and get a better position in Google results.
#6 step
The next task is to open your article on the web, check out how many backlinks you have to your web page, and check how many links you have in total. You do that by simply counting links. This number should be as high as possible.
Google Analytics
#1 step
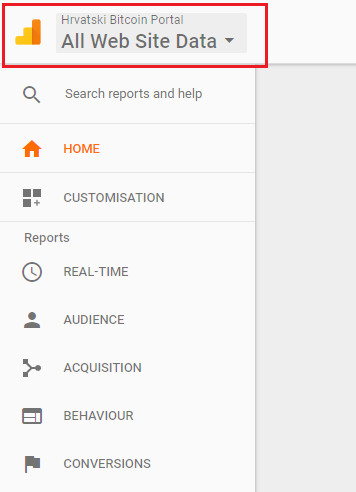
Our following tool is GA, so go to your project and start by clicking on the All Web Site Data.
#2 step
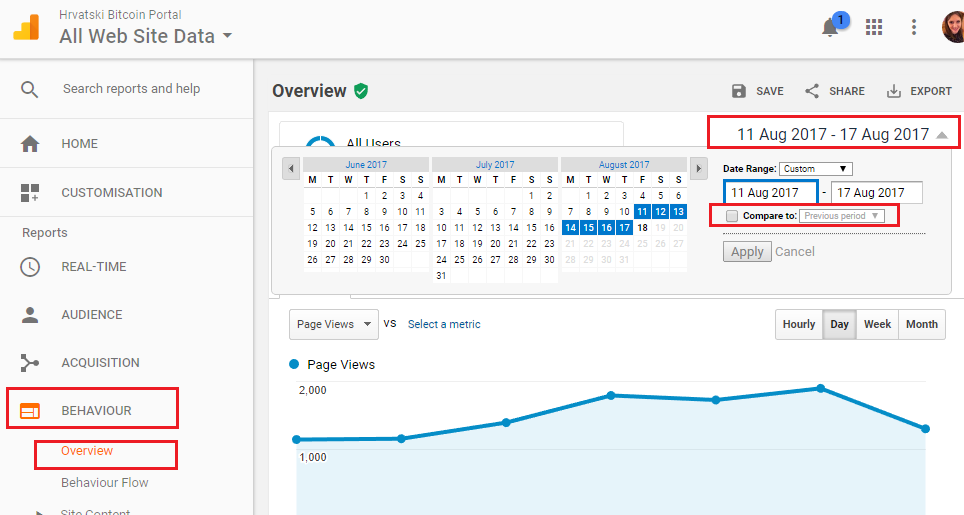
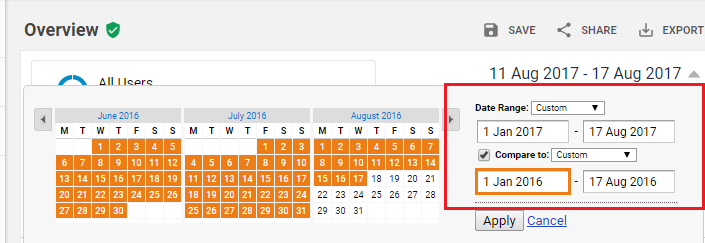
The next step is to set the period for which we want to analyze our article. So, click on the Behaviour -> Overview -> Date. Here you can also compare the Date to the previous year or some other period interesting to you.
#3 step
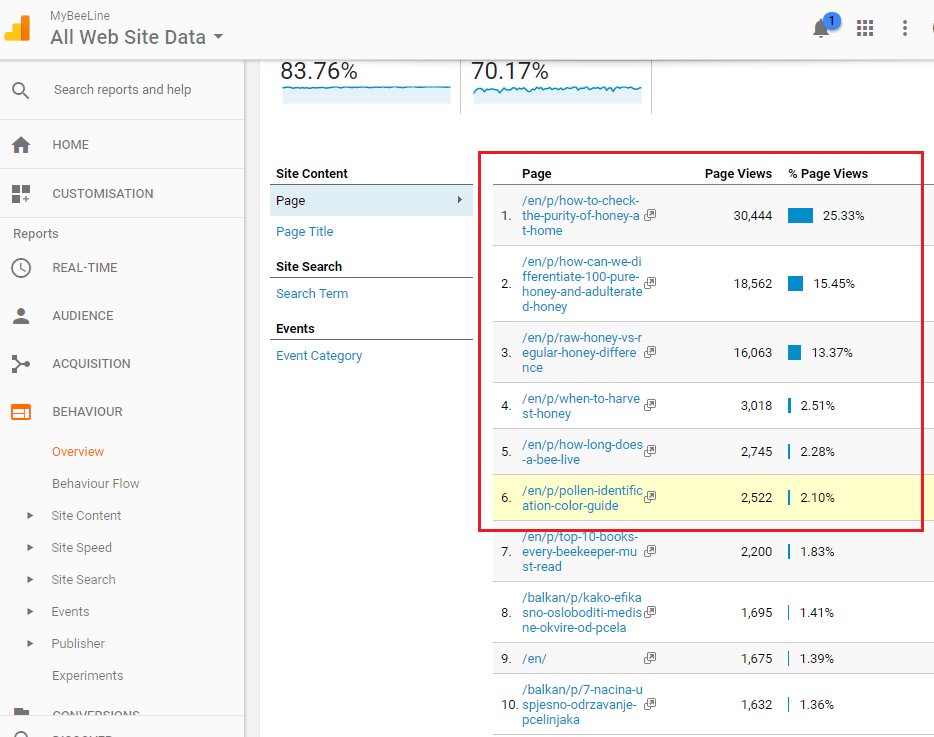
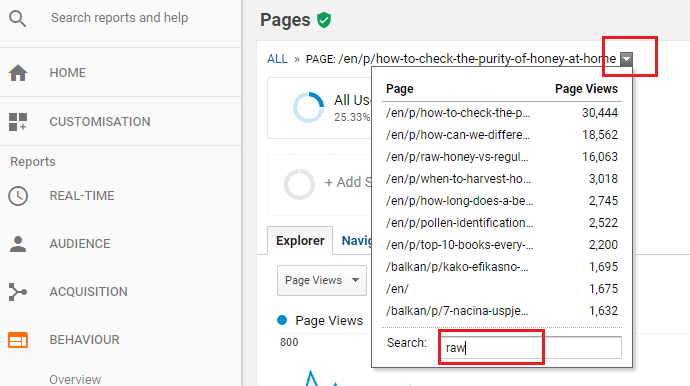
Now find your article below and click on it. If your article isn’t in the top 10 results in GA, click on any article, then click on Drop Down Menu and find your article by typing a keyword from the caption of the article you’re analyzing.
#4 step
To analyze an article click on Secondary dimension -> Acquisition -> Source.
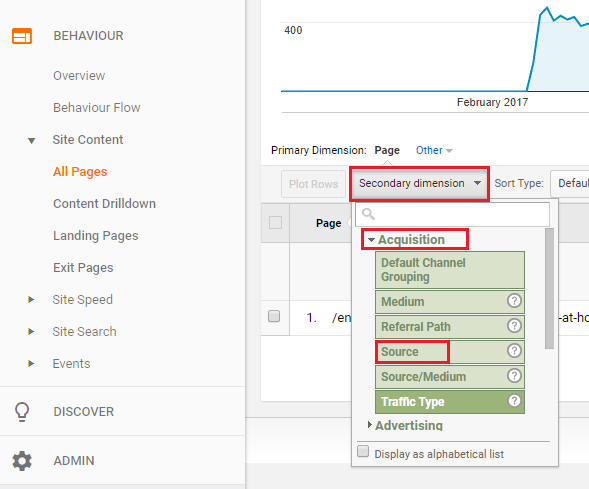
After you do that, your screen should look like the photo below.
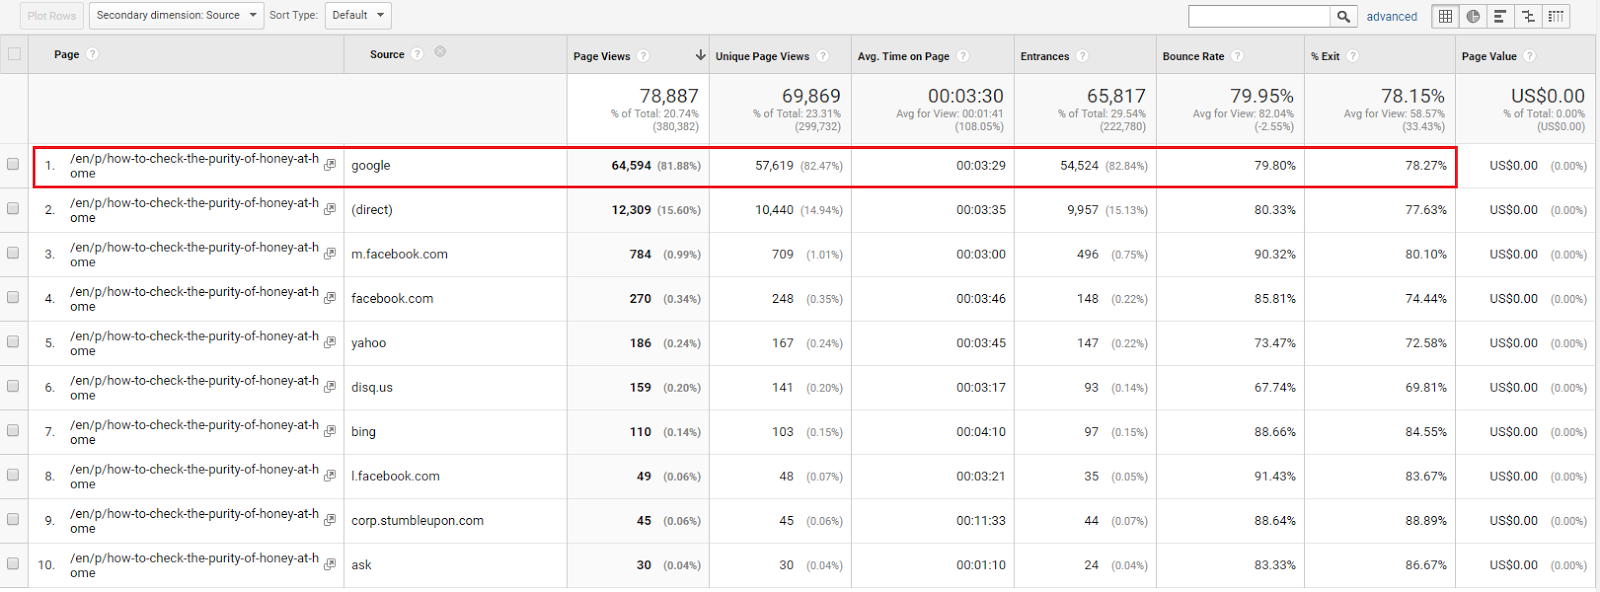
What can you see from the photo?
You can see how people find your content. In our example, most visitors come through Google (usually the case), but you can also see how long the visitors stay on your article.
What can you do with that information?
For example, if people from Facebook are staying on your article the longest, that means that they are the most interested in your topic, and you need to share your page with them.
#5 step
It is essential to optimize load time in countries with the most visitors (we did analyze per country in step 4 in GSC). Also, we can check our top countries in GA, click Behaviour -> Overview -> Country -> View Full Report, and the result will be the top 10 countries that bring you the most visitors.
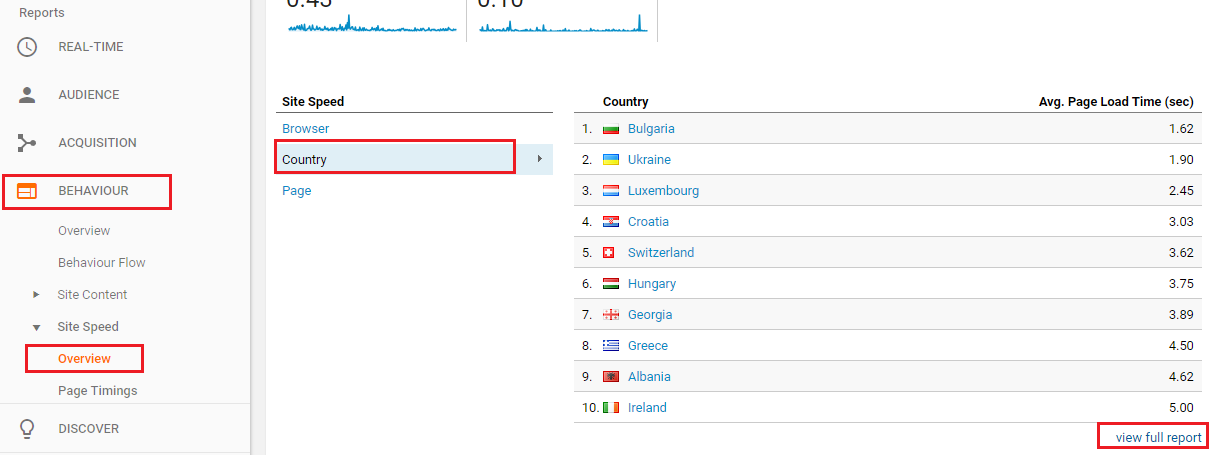
In our example, we have the most visitors from the US, and we are going to check the time needed to load our page in the US. Just click on the country (we click on the US), and in the right corner, you will see the time needed to load your page measured in seconds.
#6 step
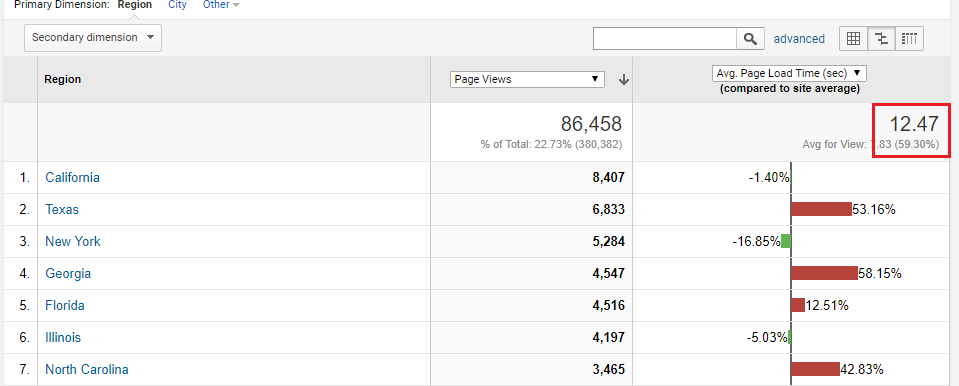
You can see that our page loads more than 12 seconds (photo below) in the US, which is a pretty lousy result since our primary traffic is from the US. You can check this statistic for any country, and if you get a terrible outcome (as we did), you need to fix this problem by loading the page.
Learn how to interpret all significant numbers from GSC and GA and beat competitors independently without paying a coin to analysts.
Want to exceed your marketing goals and improve SEO on website? Start building your digital strategy today and contact us at hello@asynclabs.co.
